For more than two decades, climate reporting has been dominated by a simple unit: the tonne of carbon dioxide equivalent.
The tonne matters. It enables inventories, targets, carbon pricing, regulatory reporting and comparison across companies and countries. Without it, there would be no common language for tracking the emissions driving climate change.
But a tonne is also abstract.
It does not tell a board how a proposed investment could affect food production, labour productivity, heat exposure, ecosystems, supply chains or local economic resilience. It does not show a planning authority the difference between approving one fossil-fuel project and another. It does not automatically help an investor connect a company’s emissions pathway to physical climate risk.
That is why a new tool called the Carbon Impacts Tracer is worth attention.
Developed by researchers associated with the Australian National University, the Australian Research Council Centre of Excellence for the Weather of the 21st Century and the Lethal Humidity Global Council, the tool translates a known quantity of CO₂ emissions into estimates across eight environmental and socioeconomic impact categories. These include lost food production, heat-related labour losses, glacier loss, coral impacts and additional exposure to unprecedented heat.
Its purpose is not to predict the precise future of a particular community.
Its more important contribution is conceptual: it helps move carbon accounting from an exercise in counting tonnes toward an exercise in understanding consequences.
Why the tonne has not been enough
A company can report millions of tonnes of emissions and still leave decision-makers with basic unanswered questions.
What does the number mean for:
The communities exposed to heat?
Agricultural productivity?
Water and food security?
Employees working outdoors or in high-temperature environments?
Insurance costs and asset values?
The resilience of supply chains?
Ecosystems already close to critical thresholds?
The social licence of a proposed project?
Standard emissions reporting was not designed to answer all of these questions. Its main purpose is measurement and disclosure.
But as climate risk becomes more material to business and public policy, emissions need to be interpreted alongside their consequences.
The Carbon Impacts Tracer uses an established relationship known as the Transient Climate Response to CO₂ Emissions, or TCRE. In broad terms, TCRE links cumulative CO₂ emissions to the amount of global warming they cause. The tool then draws on peer-reviewed research to estimate the potential implications of that warming across several impact categories.
The distinction matters.
A carbon inventory tells us how much is emitted.
An impact tool asks what those emissions may mean in the real world.
Carbon impacts are distributed unevenly
Climate change is global, but its harms are not evenly shared.
A tonne of CO₂ has the same effect on global warming regardless of where it is emitted. But the consequences of that warming fall differently across countries, communities, ecosystems and sectors.
Heat stress may have severe effects on workers in regions with high outdoor labour exposure. Crop losses may matter most in food-insecure areas. Glacier melt affects water systems, sea-level rise and mountain communities in ways that cannot be understood through an average global number alone.
This is why impact-based accounting can be especially useful for companies with global value chains.
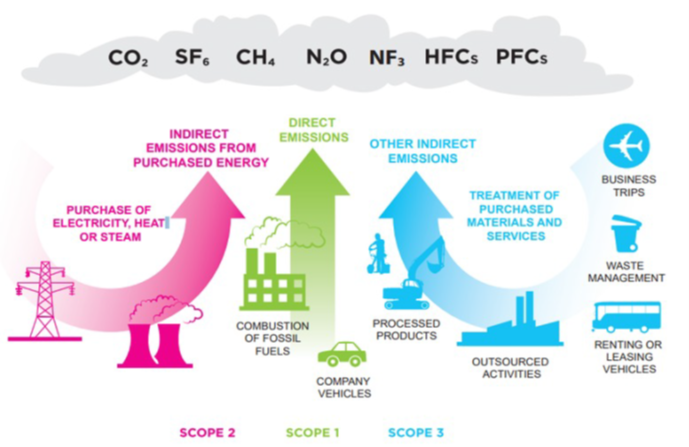
A manufacturer sourcing from multiple countries may need to understand not only its Scope 3 emissions, but also how climate hazards could affect the communities, suppliers and assets connected to those emissions.
A lender may need to understand whether financed emissions are creating risks that could later reappear as credit risk, insurance risk or asset-stranding risk.
A public authority may need a clearer picture of the consequences of a proposed project than “X million tonnes over its lifetime.”
The more emissions information can be connected to physical and socioeconomic outcomes, the more useful it becomes for real decisions.
The opportunity: better decisions
Impact tools should not replace traditional carbon accounting, lifecycle assessment, climate scenario analysis or local environmental assessment.
They serve a different purpose.
Their value lies in helping decision-makers ask better questions.
For example:
A board considering a major capital project could assess not only its expected carbon footprint, but the kinds of climate harms associated with that footprint.
A bank could use impact estimates as one input into a broader climate-risk assessment for high-emitting assets.
A government could use the analysis to explain the trade-offs associated with long-lived fossil-fuel infrastructure.
A company could connect emissions-reduction investment to avoided risk in food, labour, ecosystems or supply chains.
Civil-society organisations and communities could use the tool to make climate impacts more visible in planning and permitting debates.
The key word is input.
No single tool can settle complex decisions about energy, development, equity or public policy. But a clear estimate of potential harm can prevent carbon data from being treated as a remote technical detail.
The risk: false precision
There is an important caution.
Climate-impact estimates involve uncertainty.
They rely on assumptions about future emissions, climate sensitivity, the translation of warming into impacts and the way global effects may emerge over time. The science can be robust while the specific numerical output remains an estimate rather than a guarantee.
That means the numbers should not be presented as exact forecasts.
A tool might estimate the additional number of people exposed to extreme heat or the equivalent food-production impact associated with a project’s lifetime emissions. That is useful for illustrating scale and direction. It is not a prediction that identifies precisely who will be affected, where or when.
Responsible use requires users to:
State the methodology and assumptions clearly.
Use ranges and uncertainty where available.
Avoid implying a direct, one-to-one causal chain from one project to one local outcome.
Combine global impact estimates with local environmental, social and economic analysis.
Treat results as a decision-support tool, not a substitute for democratic or regulatory judgement.
This is not a reason to dismiss the analysis. It is a reason to communicate it honestly.
Carbon accounting is becoming impact accounting
The emergence of tools like the Carbon Impacts Tracer points to a wider change in sustainability practice.
For years, the emphasis has been on disclosure: calculate emissions, publish targets, track progress and report performance.
The next stage is decision usefulness.
Investors, boards, policymakers and communities increasingly want to know whether climate information changes what an organisation does. They want to see the link between carbon data and capital allocation, procurement, product design, infrastructure planning, transition strategies and risk management.
That requires more than a corporate footprint.
It requires an evidence architecture that connects:
Emissions data
Physical climate risk
Nature impacts
Social vulnerability
Financial exposure
Strategic decisions
Accountability for outcomes
The question is no longer only, “What is our carbon footprint?”
It is also, “What does that footprint mean—and what are we going to do differently because of it?”
What companies should do now
Businesses do not need to wait for a perfect universal impact metric.
They can begin by improving the connection between carbon data and decision-making.
A practical approach includes:
Identifying the largest sources of emissions and the decisions that drive them.
Mapping which suppliers, assets, workforces and communities are exposed to climate hazards.
Using scenario analysis to test how climate and transition risks could affect operations.
Linking capital-expenditure decisions to emissions-reduction and resilience outcomes.
Reporting not only targets, but the assumptions, investments and governance needed to deliver them.
Explaining the limitations of climate-impact estimates openly.
Prioritising real emissions reductions before relying on compensation claims.
The most credible climate strategies will not be those with the most polished carbon dashboard.
They will be the ones that can show how carbon information changes investment, operations and accountability.
Conclusion
The Carbon Impacts Tracer does not make the climate crisis simple.
It makes one part of it more visible.
By translating tonnes of CO₂ into estimated effects on heat, food, labour, glaciers and ecosystems, it gives companies and policymakers a way to talk about emissions in the language of consequences.
That can make carbon reporting more human, more relevant and more difficult to ignore.
The future of carbon accounting is not just better measurement.
It is better judgement.
Sources
The Guardian: New tool directly links carbon emissions to environmental and economic damage
Phys.org: We can finally measure the damage each new coal, gas or oil project causes
RenewEconomy: Australian researchers launch carbon-impact tool for new fossil-fuel projects
Intergovernmental Panel on Climate Change: Sixth Assessment Report